
QR Code Campaign Tracking for Print
If you put the exact same QR code on a window poster, a checkout counter, and an event program, you will know that the code generated redirect clicks, but you will not know which physical placement drove them. To measure print effectively, you need a setup that isolates each surface by giving every printed placement its own tagged short link, then generating a unique QR code for each location.
This approach requires two separate measurement layers. First, a link shortening tool like Trnqify manages the tagged URLs and records a redirect click every time a phone scans the code. Second, your destination analytics platform records the resulting website session and any subsequent conversions. Because these two systems measure different parts of the journey, their totals will rarely match exactly.
By the end of this setup, you will have a working QR code campaign tracking system that attributes traffic to specific offline locations. Building it requires access to your destination website analytics, a Trnqify account to manage short links, and a dedicated QR code generation tool to create the final print artwork.
Define What Each Placement Must Reveal
Before creating a single link, map out exactly which physical surfaces need tracking. Because the goal is to identify the physical placement that prompted the visit, rather than the specific person who scanned the code, every distinct location requires a stable identifier. A generic tag like “store_promo” provides no clarity on whether the window display or the flyer drove the traffic.
List every physical surface that will carry a code, grouping them logically so that anyone reading your analytics reports can understand the physical context of the scan. You might organize placements by store location, physical format, or neighborhood. When the scan occurs, Trnqify acts as the short-link layer to process the redirect and log the click, while your destination site analytics takes over once the landing page loads to measure how long the visitor stayed and whether they completed a purchase.
Step 1: Tag a Separate Short Link for Every Placement
Your destination analytics platform relies on UTM parameters to categorize incoming traffic. To measure distinct placements, keep your campaign and medium values consistent across the entire project, but assign a unique source value to every printed location.
Google Analytics documentation for collecting campaign data with custom URLs describes the source parameter as the referrer, the medium as the marketing channel, and the campaign as the overall promotion. Because parameter values are case-sensitive, using lowercase values prevents your analytics platform from splitting identical traffic into separate rows due to mixed capitalization.
Set up a placement log that assigns specific tags to each physical surface:
| Printed placement | utm_source | utm_medium | utm_campaign |
|---|---|---|---|
| Store 014 window poster | store_014_window | qr | fall_open_house |
| Store 014 counter card | store_014_counter | qr | fall_open_house |
| Event program | regional_event_program | qr | fall_open_house |
Create a separate short link for every row in your log, even if all three links point to the identical landing page URL. Because each short link carries its placement tags, Trnqify can report on each placement individually in your link analytics, and those tags pass the exact physical location data to your destination reporting.
Instead of typing these strings manually, you can use the Trnqify AI UTM Assistant inside the app to generate them. Providing a plain-language prompt such as, “For the fall open house, suggest lowercase source, medium, and campaign tags for a QR link on the window poster at store 014, keeping the medium as qr,” prompts the assistant to return suggested tags. Review the output to confirm the naming convention matches your established log before generating the final short link. For developers managing high-volume print runs, Trnqify provides an MCP server that allows AI agents to automate campaign tagging and link creation programmatically via API, depending on plan access.
Be aware that using a custom medium like “qr” often results in traffic appearing as Unassigned in the default channel grouping of Google Analytics 4. The raw source and medium values remain intact and available for analysis, but if your team requires a named QR grouping in top-level reports, you can configure a custom channel group in your analytics settings to recognize the exact medium value.

Step 2: Choose Static or Dynamic QR Routing
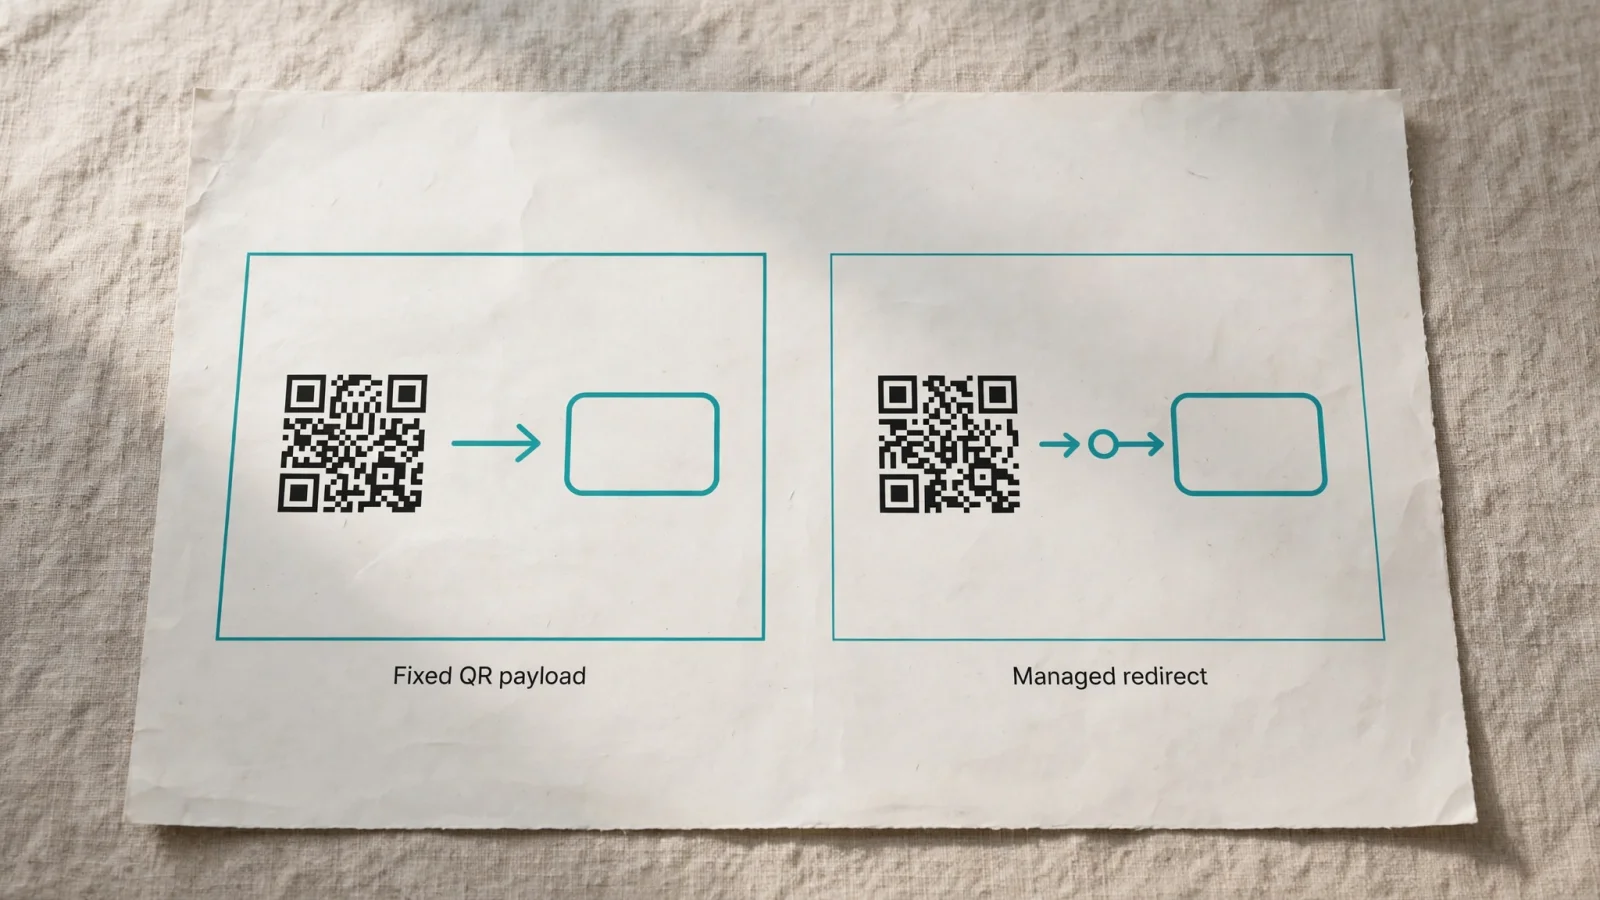
Generating the final print artwork requires choosing between static and dynamic QR formats. In standard vendor terminology, a static QR code contains fixed data that cannot change once printed, whereas a dynamic QR code typically contains a managed short URL that points to a redirect service and can be updated to point to a different destination after printing.
The term “static” refers only to the image payload, so a static QR code can still be tracked. By encoding a tagged Trnqify short link into a static QR image, the device requests the Trnqify URL when scanned, allowing Trnqify to record the click before redirecting the visitor to the destination. You retain full click analytics without needing a secondary dynamic QR provider.
Using a third-party dynamic QR provider creates an operational trade-off. While a dynamic code provides flexibility if you frequently change destinations for seasonal campaigns without reprinting displays, pointing a provider’s dynamic code at a Trnqify short link creates two separate redirects. The request hits the provider’s server, passes to Trnqify’s server, and finally reaches your landing page, which adds latency and introduces two different tracking systems that will count scans using different methodologies.
Evaluate the need for post-print editing against the complexity of multiple redirects. For permanent displays where the destination URL will not change, encode a Trnqify short link directly into a static QR image. For temporary campaigns where destinations shift weekly, evaluate whether comparing your tracking options justifies adding a dedicated dynamic provider to the routing path.
Step 3: Generate and Proof Each QR Code
Take your list of tagged Trnqify short URLs to a dedicated QR generation tool to create the final print files, generating one distinct image for each URL in your placement log.
Before sending files to print, verify the redirect path and the physical scanning properties of the artwork. Scan the code on a monitor using your phone and watch the browser address bar as the redirect completes to confirm that the final landing page URL contains all the intended UTM parameters. If the parameters drop during the redirect, the destination analytics platform will record the visit as direct traffic.
Next, proof the code for physical readability. The 2D Barcodes implementation guideline published by GS1 specifies that QR codes require a quiet zone of four module widths on all sides, and warns that poor contrast makes reading difficult. Ensure your design team has not encroached on this blank border and has maintained high contrast between the dark modules and the light background.
Avoid relying on universal minimum-size rules for print. According to the DENSO WAVE QR code FAQ, a QR Code’s size depends on its module size and version, with the version determined by the amount of encoded data. The minimum printable size also depends on the printer and QR Code reader, so print a physical proof at the final intended size to check performance.
Step 4: Compare Redirect Clicks with Landing-Page Sessions
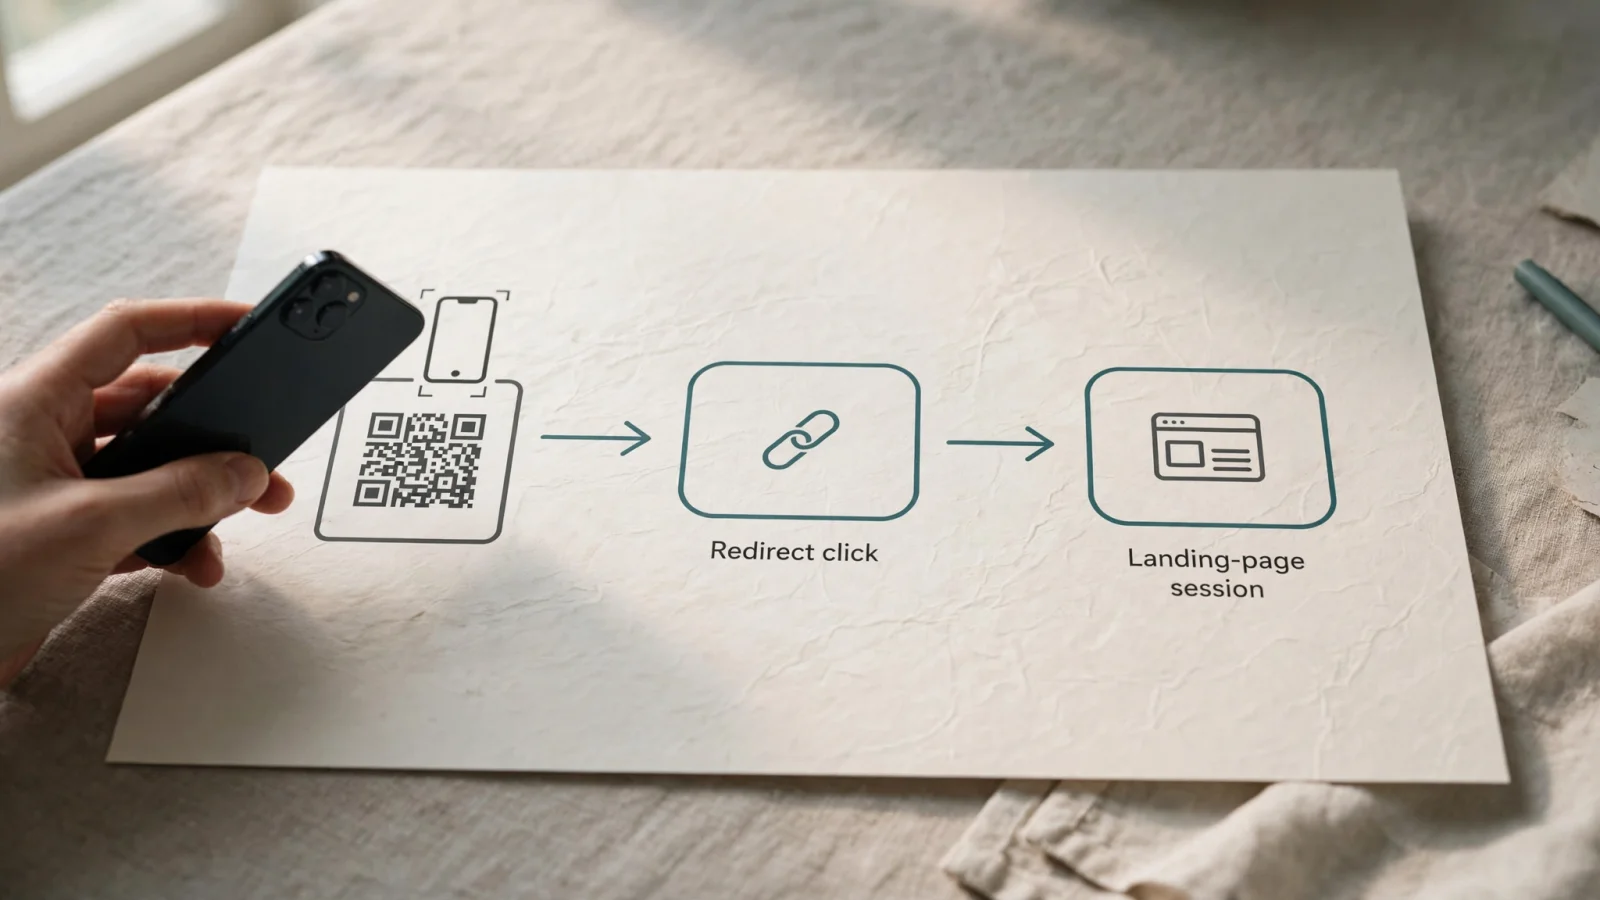
The most frequent point of confusion in offline tracking is the difference between redirect clicks and website sessions. They measure different stages of the visitor journey, so their numbers will rarely align.
The journey begins when a printed code is scanned and the phone requests the encoded short URL, prompting Trnqify to receive this request and record a redirect click at that exact moment. Trnqify handles this measurement without placing cookies or tracking scripts on the shared link redirect, maintaining privacy-focused click analytics at the routing layer. The server then instructs the phone browser to load the tagged destination URL. Only after the browser requests that final URL, downloads the page, and executes the destination site’s tracking scripts does the analytics platform record a session.
A redirect click confirms that a device asked for the link, whereas a session confirms that the landing page finished loading and the analytics platform recognized the visitor.
Google Analytics 4 has specific criteria for the start of a session. According to Google’s documentation about Analytics sessions, a session begins when a user views a page or screen with no currently active session. By default, an active session times out after 30 minutes of inactivity, though administrators can adjust this window.
This timeout logic explains why click counts often exceed session counts. Imagine a customer scans the code on a window poster, reads the landing page, puts their phone away, walks inside the store, and scans a counter card 15 minutes later to find the same page. Trnqify processes two separate requests and logs two redirect clicks. The destination analytics platform sees the second pageview as part of the ongoing session because the 30-minute inactivity timer has not expired. Your reporting will show two link clicks, but only one session.
Discrepancies also occur through technical failures. A user might scan the code, trigger the redirect click on Trnqify, and close their browser before the page loads due to a poor cellular connection. Trnqify reports the redirect request, but the destination analytics platform never sees the visit because the page did not finish loading.
When evaluating campaign performance, treat these metrics as separate indicators by using Trnqify redirect clicks to compare the raw engagement of your physical placements against each other. Use your destination analytics sessions, campaign reports, and conversion tracking to understand what visitors did after they arrived. Labeling the short-link metric “redirect clicks” or “link clicks” maintains clarity with your stakeholders, rather than referring to them as unique people, confirmed sessions, or guaranteed conversions.
Troubleshoot Common QR Tracking Gaps
Even with careful planning, offline tracking setups can produce unexpected reporting gaps, which you can diagnose by isolating the step where the tracking logic breaks down.
If you notice high scan volume but cannot attribute visits to specific posters or flyers, check your placement log. When the exact same QR URL is printed on multiple distinct surfaces, the tracking data merges and cannot be separated after the fact. Issuing a different tagged link and generating a new QR code for each specific location moving forward resolves this overlap.
If your destination analytics show the traffic arriving, but the channel reports categorize the visits as Unassigned, the UTM tags are functioning but failing to match the platform’s default sorting rules. The source and medium data remains intact in your traffic acquisition reports. Point your team toward source and medium reporting dimensions, or build a custom channel group that recognizes your chosen medium value.
If you are trying to map exact physical locations using Trnqify’s Pro tier city-level analytics, remember that IP-based location data shows roughly where the scanning device connects to the internet, not the location of the printed surface. A commuter might scan a subway ad in one district while their cellular provider routes their traffic through a node in another, so rely on your unique utm_source tags to identify the exact printed placement.
If you printed a static QR code and need to change where the link points, evaluate the redirect layer. Because a static QR code payload cannot be changed once printed, the final destination can only change if the specific redirect service encoded in the image permits editing. Confirm your tool’s capabilities before assuming a printed link can be redirected to a new promotional offer.
Verify the entire setup before full production by generating the codes, scanning the physical proofs, and watching the redirect complete in the browser address bar to confirm the specific tags appear in your destination analytics realtime reporting. When the physical placement identifier shows up on your screen, the system is ready for the print run.
Trnqify combines an AI UTM Assistant with privacy-first redirect measurement, giving you clean link analytics for your offline campaigns without relying on cookies or tracking scripts. Start building your placement log today at Trnqify.com.
Frequently Asked Questions
What's the difference between redirect clicks and website sessions?
Redirect clicks count every time a phone scans a QR code and requests the encoded short URL. Website sessions count only when the landing page finishes loading AND the destination analytics platform recognizes the visitor. Click counts will always be higher than session counts — that's normal and expected.
Why do QR click counts exceed landing page sessions?
Because they measure different stages of the journey. A redirect click happens the moment the QR code is scanned. A session requires the page to fully load, analytics scripts to execute, and a session timer to start. Users who close their browser before the page loads, or who scan multiple codes within 30 minutes (GA4's default session window), create the gap.
Should I use static or dynamic QR codes for print campaigns?
For permanent displays (window posters, counter cards) where the destination won't change, use **static QR codes** encoding a Trnqify short link directly. This gives you full click analytics in one redirect hop. For temporary campaigns that shift destinations weekly, a dynamic QR provider adds flexibility but introduces two redirects and dual-tracking overhead.
How do I track which physical placement drove a scan?
Give every printed surface its own tagged short link. Use unique `utm_source` values (e.g., `store_014_window`, `event_program`) in your placement log. Each QR code encodes its own unique URL, so Trnqify reports clicks per placement independently.
Why is my QR traffic showing as "Unassigned" in Google Analytics?
The `qr` medium value often falls outside GA4's default channel groupings. The source and medium data is still intact — check your traffic acquisition reports by source/medium dimensions, or create a custom channel grouping that recognizes `qr` as its own category.