
Account-Wide Link Analytics Dashboard (2026)

An account-wide link analytics dashboard answers the question per-link reports can’t: what is working across everything you share? Until now, understanding your links meant opening them one at a time. That works for a single launch. It breaks down when you manage dozens of links across campaigns, channels, and domains.
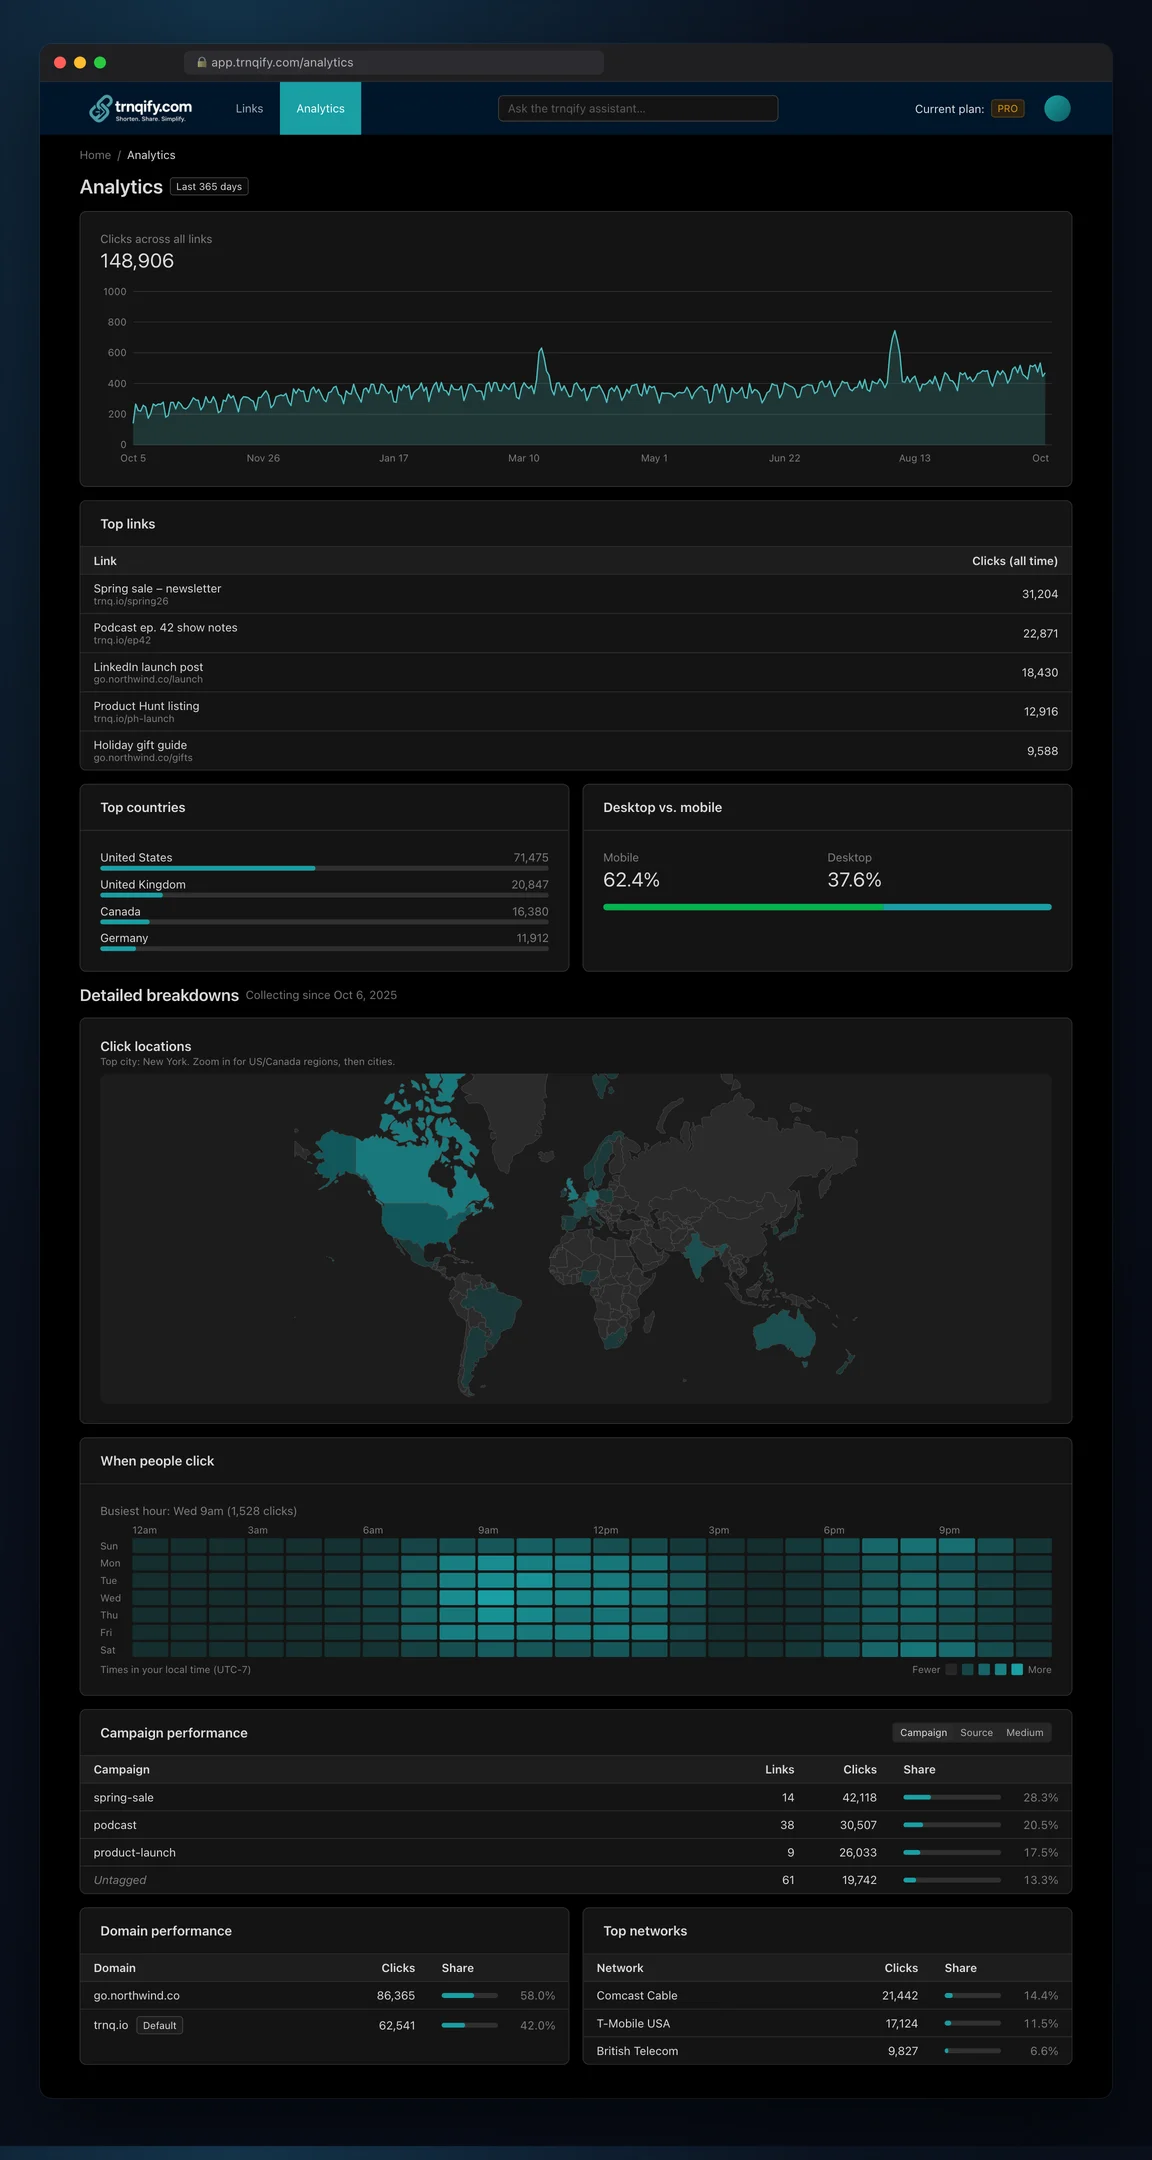
Today Trnqify adds the account-wide analytics dashboard as a new Analytics page next to Links. It sums click activity across every short link you own, so one screen answers the question that matters: what is working across all of it?
Every plan gets the dashboard. Pro unlocks the deepest breakdowns. Here is what is in each tier, how it respects privacy, and how to put it to work. You can also see the full list on the features page.
What Is the Account-Wide Analytics Dashboard?
Per-link analytics tell you how one link performed. The new dashboard adds up all of them:
- One trend line for clicks across your whole account, not a single link.
- Top links ranked so you can see which destinations earn attention.
- Audience breakdowns (location, device, and more on higher plans) calculated over every click.
Find it in the Trnqify app under Analytics, right beside Links. Per-link analytics are still there when you want to drill into one link.
Why Account-Wide Link Analytics Matter
Single-link reports hide the big picture. A link can look weak on its own while your account is growing, or one viral link can mask a drop everywhere else. Rolling clicks up across every link lets you:
- Spot which links and channels deserve more effort, and which to retire.
- Compare periods honestly, with one trend instead of dozens.
- Report to a team or client from a single page instead of stitching screenshots together.
What You Get on Each Plan
Trnqify keeps links unlimited on every plan, and analytics scale from a quick pulse check to a full reporting view.
| Feature | Free | Starter | Pro |
|---|---|---|---|
| Click trend across all links | 7 days | 30 days | Up to 1 year |
| Top links | Top 10 | Yes | Yes |
| Country breakdown | - | Yes | Yes |
| Desktop vs mobile | - | Yes | Yes |
| City breakdown + map | - | - | Yes |
| Browser and OS | - | - | Yes |
| Campaign, source, and medium rollup | - | - | Yes |
| Custom-domain performance split | - | - | Yes |
| Top networks | - | - | Yes |
| Day-of-week × hour heatmap | - | - | Yes |
Free gives you the 7-day trend and your top 10 links, which is enough to see what is moving this week.
Starter stretches the trend to 30 days and adds country and desktop vs mobile breakdowns, so you can tell where your audience is and what they are using.
Pro goes the furthest: up to a year of history, city-level breakdown with a map, browser and OS, campaign, source, and medium rollups, custom-domain performance, top networks, and the heatmap. Compare every plan on the pricing page.

Analytics Built on a Privacy-First Foundation
Trnqify was built as a privacy-first alternative to mainstream shorteners, and the dashboard follows the same rules:
- Aggregate data only. You see totals and breakdowns, not profiles of individual visitors.
- City level at most. Location never gets more precise than the city.
- Never sold. Click data is not resold or shared for advertising.
If you want the reasoning behind those choices, read our guide to cookie-free link tracking or the privacy policy.
Put the Dashboard to Work: Decide When and Where to Post
Numbers only matter if they change what you do. Two Pro tools are especially useful for planning.
Use the campaign rollup to find your best channels
The rollup groups clicks by the UTM campaign, source, and medium fields on each link. That means you can compare “newsletter vs LinkedIn” or “spring-sale vs evergreen” without exporting anything.
This works best when your tags are consistent. If you are not there yet, the AI UTM builder keeps naming tidy, and our guide to free UTM tracking covers a simple convention.
Use the heatmap to time your posts
The day-of-week × hour heatmap shows when your audience actually clicks. A simple routine:
- Open the heatmap and note the two or three brightest day and hour windows.
- Schedule your next batch of posts shortly before those windows.
- Check again in a few weeks to confirm the pattern held before you commit to it.
Pair that with the top networks and city map to decide where to post, not only when. For a broader look at what to measure, see our free click analytics guide.

Get Started
- Sign in to the Trnqify app and open Analytics beside Links.
- Check your top links and trend to see where attention is going.
- Tag new links with consistent UTM fields so the rollup is meaningful.
- Upgrade on the pricing page when you want deeper history and breakdowns.
Account-wide analytics gives you the whole picture without giving up your audience’s privacy. Open Trnqify and see what your links are really doing, or browse the analytics features first.
Frequently Asked Questions
What is the account-wide analytics dashboard in Trnqify?
It is a new Analytics page that sits next to Links in the Trnqify app. Instead of opening one link at a time, it adds up click activity across every short link in your account, so you can see trends, top links, and audience breakdowns in one view. Open it in the Trnqify app.
Which Trnqify plans include the analytics dashboard?
All of them. Free shows a 7-day click trend across all links plus your top 10 links. Starter adds a 30-day trend, top links, and country and desktop vs mobile breakdowns. Pro adds up to a year of history, city breakdown with a map, browser and OS, campaign, source, and medium rollups, custom-domain performance, top networks, and a day-of-week by hour heatmap. Compare plans on the pricing page.
How far back does Trnqify analytics history go?
Free reports a 7-day trend, Starter reports 30 days, and Pro keeps up to a year of history. Longer windows make seasonal patterns and campaign comparisons easier to spot.
Does the dashboard use my UTM tags?
Yes, on Pro. The campaign, source, and medium rollup is built from the UTM fields on each of your links, so naming links consistently pays off. The AI UTM assistant helps keep those values tidy. See the features page for details.
Is Trnqify analytics privacy-friendly?
Yes. The dashboard shows aggregate data only, location is never finer than city level, and click data is never sold. Read the full privacy policy.
How do I use the heatmap to decide when to post?
The Pro heatmap plots clicks by day of week and hour. Look for the brightest cells, schedule your next posts a little ahead of those windows, and compare again after a few weeks to confirm the pattern holds.